Comprehensive Guide to Cholesterol Charts: Essential Insights for Maintaining Heart Health
This comprehensive guide explores the importance of cholesterol charts in understanding and managing heart health. Learn about key cholesterol components, ideal target ranges, and how visual tools can help track your progress. Discover practical tips for maintaining healthy cholesterol levels through diet, exercise, and regular testing, empowering you to take control of your cardiovascular well-being effectively.

Comprehensive Guide to Cholesterol Charts: Essential Insights for Maintaining Heart Health
Cholesterol is a vital component of our body's functions, playing a crucial role in building cell membranes, synthesizing hormones, and allowing the body to produce vitamin D. Despite its importance, maintaining balanced cholesterol levels is essential to prevent potential health issues, especially cardiovascular diseases. Understanding your cholesterol levels through detailed charts can empower you to make healthier lifestyle choices, detect potential problems early, and work effectively with healthcare professionals to manage your heart health.
What is a cholesterol chart?
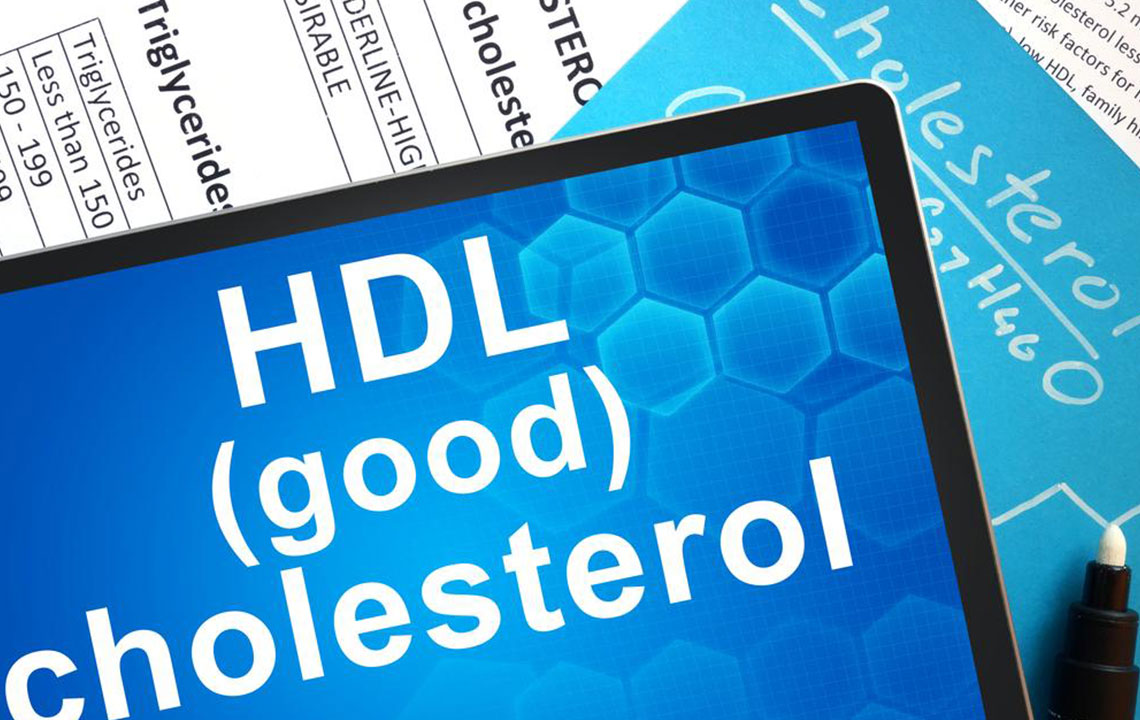
A cholesterol chart is a visual tool that displays various cholesterol-related measurements obtained from blood tests. It typically includes four vital components: total cholesterol, low-density lipoprotein (LDL), high-density lipoprotein (HDL), and triglycerides. These measurements offer a comprehensive overview of your lipid profile, helping assess how well your body manages cholesterol and fat metabolism. Regularly reviewing these charts enables individuals to track changes over time, understand the impact of lifestyle choices, and stay on top of their overall cardiovascular health.
Cholesterol charts visually depict your current levels, highlighting areas of concern such as excess buildup that may contribute to plaque formation. Plaques are hard deposits that accumulate under the lining of arteries, leading to narrowing or blockages that can cause heart attacks or strokes. These charts serve as powerful visual aids, illustrating how your levels compare to recommended guidelines and enabling you to identify risk zones at a glance. Whether you’re managing an existing condition or proactively monitoring your health, understanding these visual representations can be instrumental in making informed decisions.
Key target ranges in cholesterol management include:
Total Cholesterol: Less than 200 mg/dL
Triglycerides: Under 150 mg/dL
LDL (bad cholesterol): Below 130 mg/dL
HDL (good cholesterol): Above 50 mg/dL for women and above 40 mg/dL for men (below 35 mg/dL is considered risky)
Staying within these benchmarks is critical for maintaining cardiovascular health and reducing the risk of heart-related diseases. Regular testing and comparing your results with these ranges can help you identify potential issues early, allowing for timely intervention.Advantages of utilizing cholesterol charts include:
Gaining a clear understanding of your current cholesterol status
Comparing individual results with established healthy ranges
Determining risk zones that might require medical attention or lifestyle modifications
Facilitating regular health assessments in an accessible and visual manner
However, it’s important to remember that these charts are informational tools. They should complement advice from healthcare professionals who can accurately interpret your results and recommend personalized strategies. Incorporating balanced diets rich in fiber, healthy fats, and limiting saturated and trans fats, along with regular physical activity, can significantly influence cholesterol levels. While visualization offers valuable insights, always rely on medical guidance for diagnosis and treatment plans. Consistent monitoring and proactive management are key to maintaining optimal heart health and preventing cardiovascular disease.