Comprehensive Guide to Stock Chart Analysis: Mastering Market Trends and Making Smarter Investments
This comprehensive guide explores the importance and techniques of stock chart analysis, helping investors understand market trends, identify patterns, and make informed trading decisions. It covers the historical background, key components of charts, and how to utilize them across different strategies. Discover how technical indicators and volume analysis can enhance your market insights, supported by real-world tools and platforms for better investing outcomes. Perfect for both beginners and experienced traders aiming to master technical analysis.

In-Depth Exploration of Stock Chart Analysis for Better Investment Decisions
Understanding the intricacies of the stock market is fundamental for investors who aspire to make well-informed, strategic decisions. A core aspect of successful investing involves analyzing stock charts to interpret market trends, predict future price movements, and respond to news and economic indicators effectively. Whether you're a beginner or an experienced trader, grasping how to read and interpret these charts can significantly enhance your ability to capitalize on market opportunities and mitigate risks.
Historical Roots and Significance of Technical Evaluation through Stock Charts
The practice of analyzing stock charts has a rich history dating back to the late 19th century, marking the beginning of technical analysis as a crucial methodology in finance. It is based on the premise that historical price patterns, trading volumes, and market behaviors often repeat, thus providing clues about future movements. This approach differs from fundamental analysis, which examines financial statements and economic factors. Technical analysis, through the interpretation of charts, offers traders a visual and systematic way to evaluate market sentiment and trend directions.
Every publicly traded stock, market index, or commodity listed on exchanges has a corresponding chart that visualizes performance over a specific period. These charts depict price movements over time using an XY coordinate system—where the horizontal axis represents time, and the vertical axis shows price levels. The primary focus is on closing prices, although some charts include opening, high, and low prices, providing a comprehensive picture of market activity. The latest data is generally displayed at the top of the chart, with options to view different timeframes such as daily, weekly, or monthly trends, enabling traders to analyze short-term volatility or long-term growth patterns.
The vertical axis of a stock chart indicates the price levels, while the horizontal axis marks the time span. Traders and analysts use these charts to identify fundamental trends—whether the market is experiencing an uptrend (increasing prices) or a downtrend (decreasing prices). Recognizing these patterns enables investors to develop strategies for entering or exiting positions at optimal times. Different market participants interpret charts in varied ways; day traders may focus on minute-by-minute fluctuations, whereas long-term investors analyze multi-year trajectories.
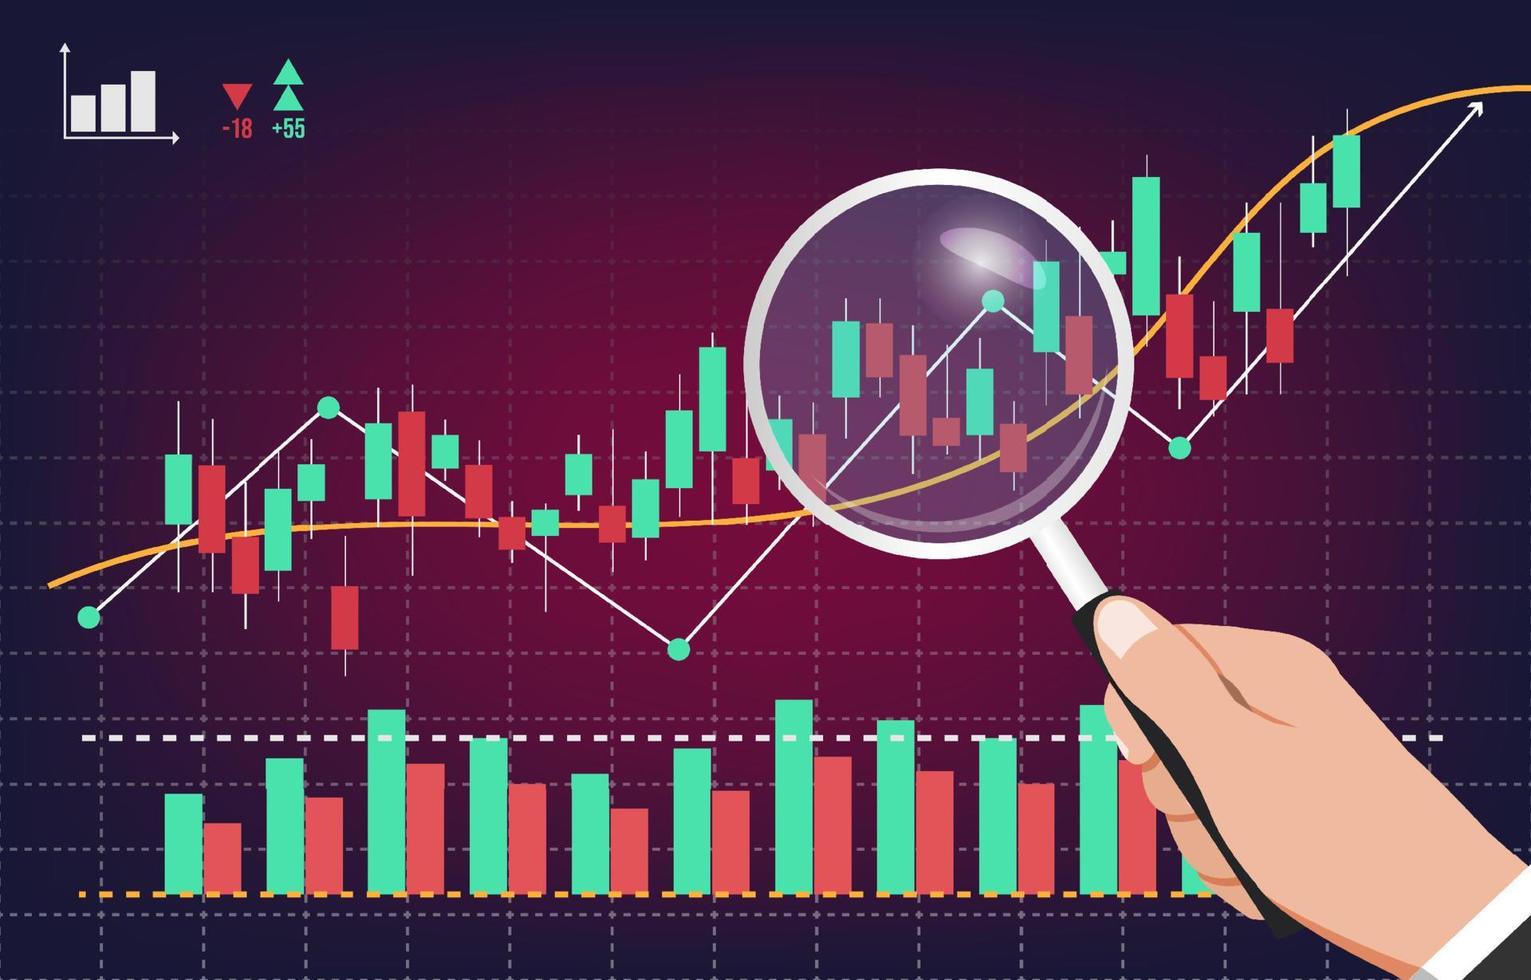
Monitoring market trends involves identifying significant chart formations such as head and shoulders, double tops or bottoms, and flags. These formations signal potential trend reversals or continuations. Market volume, displayed as histograms beneath the main chart, offers insights into the strength of price movements. Green and red bars indicate days of price increases or decreases, respectively. The moving average line, which smooths out short-term fluctuations, helps identify the overall trend direction. Combining these technical indicators with strategic insight allows traders to make informed decisions, balancing analysis with intuition.
Today, a multitude of online platforms provide free and paid access to advanced stock charting tools. Websites like www.bloomberg.com, www.reuters.com, and specialized trading platforms supply comprehensive chart analysis features for investors, students, and hobbyist traders. Leveraging these tools enhances understanding of market dynamics, regardless of your level of experience. Mastering stock chart analysis empowers traders to anticipate market movements, manage risks effectively, and optimize profitability in an ever-changing financial landscape.